PCWattVault — User Guide
PCWattVault shows you, live, how much electricity your PC is drawing and what it costs you — and it keeps recording in the background so you always know what your computer added to the power bill: today, this month, this year.
Everything happens on your own machine. There are no accounts, no cloud and no telemetry; your data never leaves your PC.
Installation
PCWattVault installs from the Microsoft Store. Sandboxed, kept up to date automatically, done.
Out of the box, GPU power is measured directly and CPU power starts as a load-based estimate marked “~”. For fully measured CPU sensors, pair the app with the free LibreHardwareMonitor. It takes a few minutes, once: download it, run it as administrator, accept the driver it offers and turn on its Remote Web Server — PCWattVault picks it up automatically. “Sensor sources” below has the steps.
First run
PCWattVault starts reading your hardware immediately. Three things worth knowing on day one:
- The window closes into the tray. Closing the window does not stop the app — it keeps recording in the notification area (that is the whole point: the history must not have holes). To really quit, right-click the tray icon → Quit (stops recording).
- “~” means estimated. Values marked with a tilde are model estimates, not sensor readings — see “Accuracy” below for how to improve them.
- A yellow “Demo data” banner means the app could not reach any real sensor source and is showing synthetic numbers so you can explore the interface. Demo data is never saved to your history.
Live watts on the tray icon. From version 1.0.19 the tray icon shows the current wall watts — white digits on a dark navy plate, readable on light, dark and coloured taskbars. It refreshes every 2 seconds and goes back to the normal logo when there is no fresh reading; hovering over it still shows the watts and the cost per hour. Windows may keep the icon behind the ^ arrow next to the clock: drag it onto the taskbar to keep the number in view. It is free and on by default; Settings → Behaviour → Show the live watts on the tray icon turns it off.
Sensor sources
The app picks the best available source automatically:
- Bridge — the built-in sensor engine; it reads your GPU (and most other hardware) directly. Store apps may not include kernel drivers, so CPU package power is out of its reach — CPU watts are estimated from load (“~”) until the next source takes over.
- LibreHardwareMonitor web server — if you already run LibreHardwareMonitor, enable Options → Remote Web Server in it and PCWattVault will use it. This is the recommended setup for the Microsoft Store edition. PCWattVault detects a running web server and switches to it automatically — nothing else to configure.
- Demo — synthetic fallback so the UI is never dead.
Setting up LibreHardwareMonitor
Download LibreHardwareMonitor only from its official GitHub page. Some other websites use the LibreHardwareMonitor name without being part of the project, and what they offer may not be the genuine program. The LibreHardwareMonitor developers warn about this themselves. The same goes for the PawnIO driver: take it only from pawnio.eu or through LibreHardwareMonitor's own driver prompt.
- Download it from its official release page on GitHub — the link always opens the newest release. LibreHardwareMonitor.zip suits most PCs; LibreHardwareMonitor.NET.10.zip needs Microsoft's .NET 10 runtime installed.
- Unzip it and run LibreHardwareMonitor as administrator. If it offers to install the PawnIO driver it needs, accept.
- Enable Options → Remote Web Server. PCWattVault connects within seconds.
Set up your tariff (2 minutes, worth it)
Out of the box the app uses a default price per kWh. For real money figures open Settings → Electricity tariff:
- Currency — pick from the list, or “Custom…” for any ISO code.
- Default price per kWh — you will find it on your electricity bill, usually stated in cents or your currency per kWh. Include taxes and network charges per kWh if you want all-in figures.
- Night/weekend prices — add a time-of-use rule per window (e.g. 23:00→07:00 at a lower price). Rules can be limited to specific weekdays and months (seasonal tariffs).
- Tiered pricing — if your utility charges by monthly consumption brackets, define the tiers; the household baseline field tells the app how much the rest of your home consumes so your PC lands in the right bracket.
- Solar / net metering — an optional price reduction during your production hours.
- Demand charge — if your contract bills the monthly peak kW.
Templates per country. From version 1.0.22, Settings → Electricity tariff → “Start from a template (optional)” gives the tariff a starting point: pick a Country, then a Template, then press Apply template. A typical flat price sets the currency and the default price per kWh to the country’s typical figure from official statistics — Eurostat for about 40 European countries, the U.S. EIA, Ofgem for the UK, ElCom for Switzerland, and PCWattVault’s own estimate elsewhere. It is a national average, a first guess rather than your price: your bill may differ. A time-of-use plan fills the time-of-use rules with the hours the country fixes, but not the prices: you type each period’s price from your bill. The rules of one period share one price — Italy’s F2 is three rules, and typing its price once fills all three — and every other hour, the plan’s rest period such as F3 or Valle, uses the default price per kWh.
The hours come from the regulators for Italy (F1/F2/F3 and F1/F23, ARERA), Spain (2.0TD, CNMC), Portugal (bi-horário and tri-horário, ERSE), Greece (the dual-zone tariff, ΔΕΔΔΗΕ) and Türkiye (the three-time tariff, EPDK). For Poland (G12/G12w), France (HP/HC) and the UK (Economy 7) they are typical hours, to check against your bill, because they vary by supplier or area. Where the rules cannot follow the bill, the picker says so: public holidays count as ordinary days (Italy, Spain, Poland’s G12w), and Portugal’s seasons switch on the 1st of the month rather than at the clock change. Nothing changes until you press Save settings; Discard changes puts the old tariff back. Whatever you start from, include taxes and network charges per kWh in the prices you type — in several countries, Greece among them, offers quote the energy charge alone. The templates ship with each release: the app never fetches prices online.
Grid CO₂ per country. From version 1.0.22, Settings → Electricity tariff → “CO₂ (optional, indicative)” → Country preset lists every country — 77, plus the European Union and the world average — from one source with one method: Ember 2025, lifecycle grams of CO₂e per kWh generated, via Our World in Data. A new install starts with its country’s figure. An install still on the old flat 300 g/kWh shows its country’s figure under the field, with a button to use it — for Greece, “Use 315 g/kWh”. Like the templates, the figures ship with the app; nothing is fetched online.
Reading the dashboard
- The battery card — at the top, only on PCs that have a battery (from version 1.0.18; free, with either sensor source). On battery it shows “🔋 On battery”, the charge, the time left at the current draw and the battery’s health. On the charger it shows “🔌 Charging” or “🔌 On the charger”, with the charge and the health but no time left. Time left is the remaining capacity divided by the battery’s own discharge rate, averaged over the last minute so it does not jump; the average starts again whenever the charger is plugged in or unplugged, and for about 10 seconds after unplugging the card shows “estimating time left…”. Health is the capacity the battery holds when full, as a share of the capacity it was designed for — hover over it to see both in Wh.
- Current draw — your PC’s wall-socket power right now. The line under the figure says where it comes from: “measured at the wall (smart plug)” is a smart plug’s real reading at the wall; “measured by the power supply” is a power supply that reports its input power; “power supply output · wall at N% efficiency” is a Corsair HXi/RMi or MSI MEG Ai, which reports the power it delivers to the PC, turned into wall power at the efficiency shown. On a laptop, “measured from the battery” is the battery’s own measurement on battery, and “calibrated on battery” is the estimate on the charger once it has learned from the battery. Otherwise the figure is the model: the component sensors plus base load, divided by your PSU efficiency.
- Cost rate — what one hour at the current draw costs, at the tariff active right now.
- Today / This month — recorded consumption so far.
- Month-end forecast — where the current calendar month will land: what is already recorded plus the average of your recent days for the days remaining.
- “At current draw — if it ran 24/7” — a live extrapolation of the present wattage. It answers “what if I left it like this?”, not “what will I actually pay?” — that is the forecast’s job.
- Live chart — wall power over time, from 5 minutes to 24 hours. The buffer fills even while the window is hidden. Hover over it to see the time and the watts — and, with power per app on, the three apps drawing most at that moment. From version 1.0.20 the tooltip also names the components behind the watts — for example “CPU 135 W · GPU 58.5 W · Base load 34 W · PSU loss 33.8 W” — before the apps. From version 1.0.22, with a measured wall, an “Unattributed” line can appear as well — see The calibration bar.
- Top power consumers — each device with its own power reading (every GPU separately, CPU, drives…), ranked live. Estimated entries carry “~”.
- The apps line (Pro) — under the cards at the top, the three apps drawing most right now, with All apps → to open the Apps page.
Power per app (Pro)
The Apps page, right under Dashboard in the sidebar, shows which programs your PC's power goes to and what each one costs you. Like every Pro feature, it is free for early adopters.
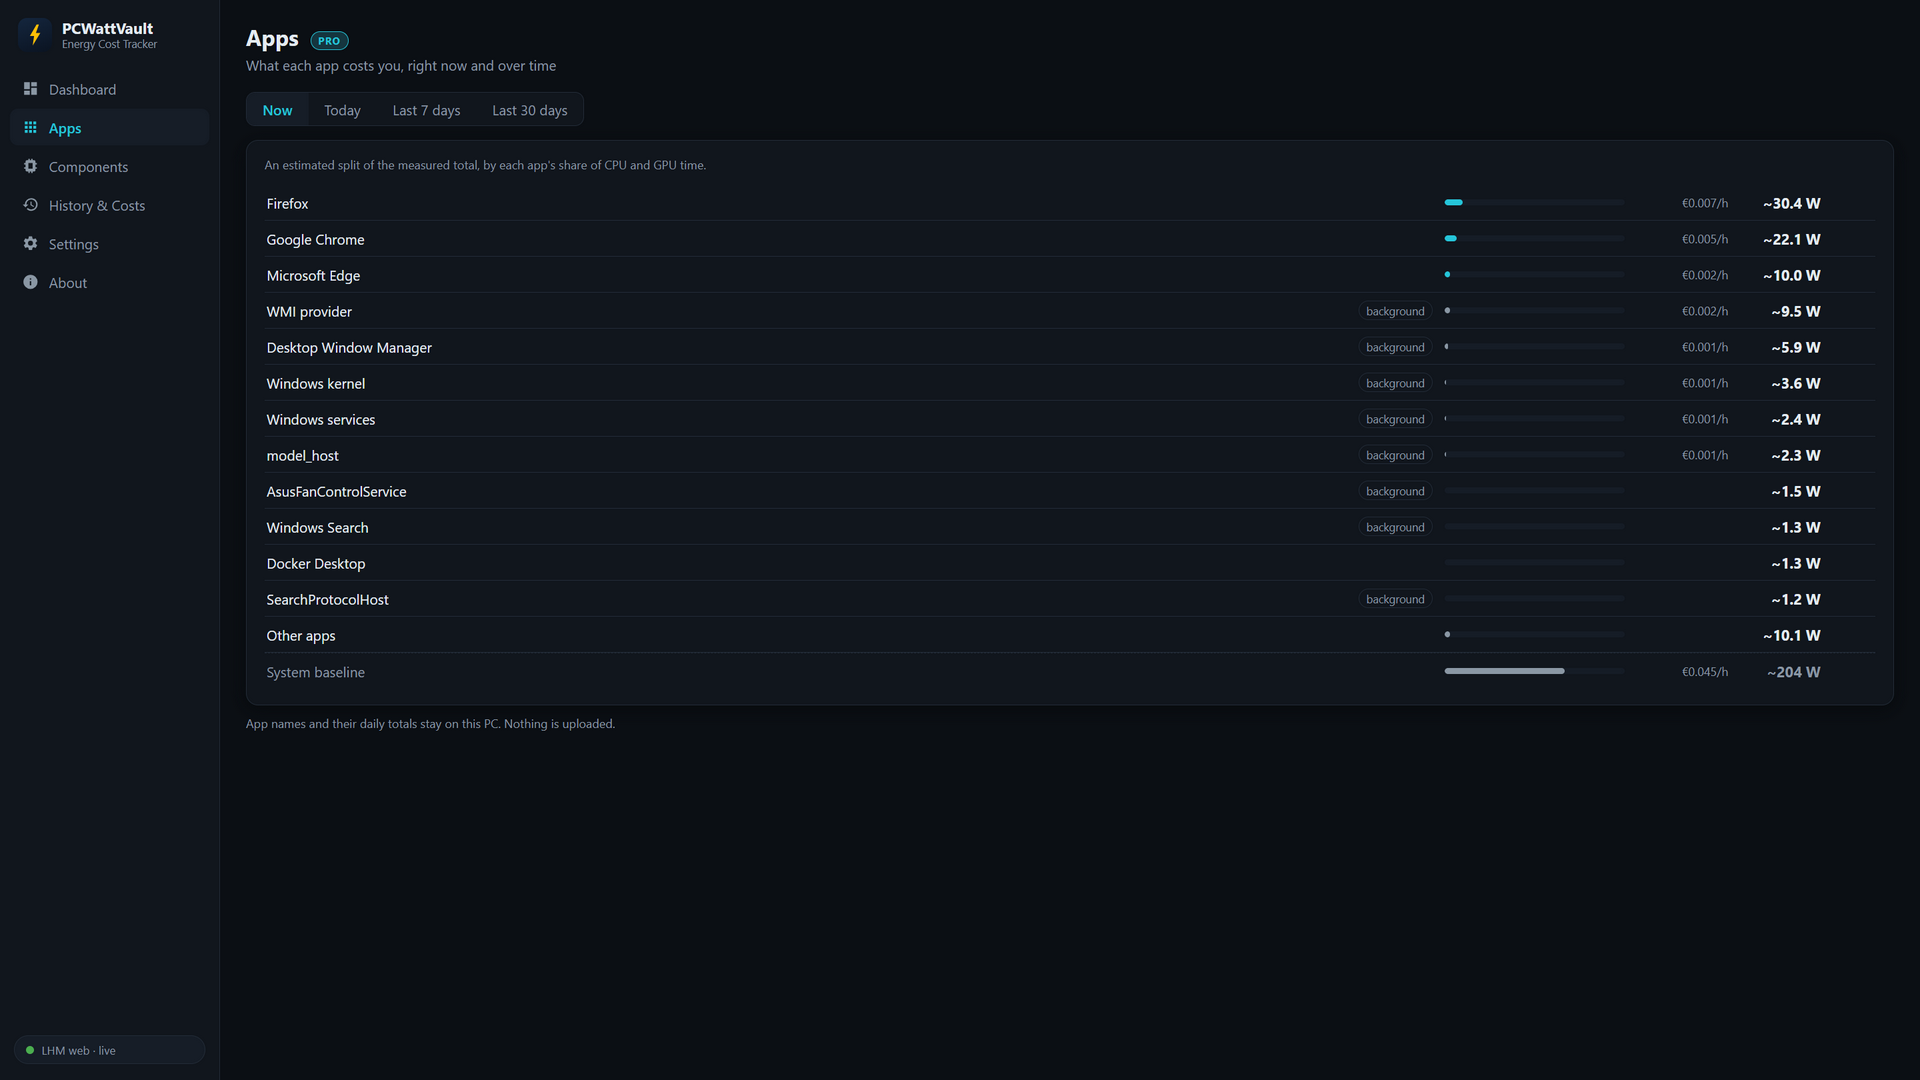
What the page shows
The Now view lists each app with its estimated watts and its cost per hour, live. The 12 apps drawing the most each get a row of their own, windowed or not; ones without a window are tagged “background”. Everything smaller, and any app you have hidden, is summed as “Other apps”. The “System baseline” row is what your PC draws whatever runs: every part's idle draw, the base load and the power supply's loss. The rows add up to the measured total.
How the split works
PCWattVault measures the total: from the hardware sensors, or at the wall with a Tapo smart plug. Only the power above each component's idle draw is shared between apps, in proportion to each app's share of CPU and GPU time. Those times come from Windows' own per-process performance counters, read every 5 seconds; no other process is opened or read. So each app's figure is an estimate — a split of a measured total, not a meter per app.
The idle draw is learnt from moments when the PC is idle. For the CPU, the power outside its cores is measured directly when the sensors allow it, so even a PC that never goes idle gets a firm split. Until the idle draw is known, the page says it is still learning.
Today, the last 7 and the last 30 days
Today, Last 7 days and Last 30 days show each app's energy and cost per day, recorded on your PC only. They list up to 25 apps before “Other apps”. The 7- and 30-day views cover whole days up to yesterday, and compare each app with the same number of days before them: ▲ or ▼ with a percentage, or “new”. The comparison appears once that earlier stretch has been recorded for at least half its length.
Click an app to see its cost per day over the last 30 days; its panel also has Alert me about this app.
Two shortcuts live outside the page. Under the cards at the top of the dashboard, one line shows the three apps drawing most right now, with All apps → to open the page. And on the live chart, hovering shows the three apps drawing most at that moment, so a spike explains itself.
Hiding an app, clearing the history
Hide on an app's row counts that app under “Other apps” from then on, and removes its name from everything already saved. Settings → Power per app lists the hidden apps (and can show them again), switches the history off, and has Clear app history — your total consumption history is not touched.
Limits
- It is an estimate. The total is measured; how it is shared between apps is not.
- File scanning by security software, your antivirus included, is kernel work, so it shows up under “Windows kernel”.
- A GPU's power is shared by GPU time, not by how hard each app pushes the GPU.
History, predictions and exports
The History & Costs page shows hourly (today), daily (30 days) and monthly (12 months) charts in kWh or money, a per-component breakdown, and lifetime totals.
Hover over a bar — today by the hour, the 30 days or the 12 months — to see what made it: its top 4 components with their cost and share, then its top 4 apps and the “System baseline” (from version 1.0.20). The components are free; the apps need power per app (Pro) with its history on. The cost per component is split hour by hour, so it is exact under a day/night tariff.
After ten complete days of recording you also get predictions for next month and next year, shown as ranges (“€24–31”). They come from a regression over your recorded days with day-of-week awareness. They are labelled indicative for a reason — treat them as a compass, not an invoice.
A note on the numbers. Everything PCWattVault shows — costs, forecasts, predictions — is an estimate intended for guidance. The app is not a billing instrument: your actual electricity bill is determined solely by your utility’s certified meter and your contract. Even with a smart plug attached, small deviations from the utility meter are normal. Do not rely on these figures for billing, cost sharing between people, or financial decisions.
Accuracy: making the numbers honest
Without a smart plug, the wall figure is a model, and from version 1.0.20 the model is fitted to your PC’s hardware. PCWattVault reads what Windows itself reports — memory modules, drives and their type, chassis, board and CPU — locally, without administrator rights and without internet:
- Base load — the watts of everything without a sensor — comes from the board class, the fans, the USB devices and the CPU’s power delivery.
- Drives are priced by type: a hard disk about 4.5 W at idle, because it spins whether or not it reads; a SATA SSD about 0.6 W; an NVMe drive about 2 W; a USB drive 1 W.
- Memory is priced per module; DDR5 modules carry their own power chip.
- The CPU estimate, used when CPU power cannot be read, follows the CPU class.
New installs get these figures automatically. An install whose base load is still the old 20 W default is offered them once, on the Dashboard (“Use N W” or “Keep 20 W”). A value you typed, or tuned with a smart plug, is never overwritten. Settings → Power model shows where the figures come from: “board and chipset”, “fans”, “USB devices” and “CPU power delivery” (on a laptop, “screen, Wi-Fi and the rest”).
Laptops start from laptop defaults — a low base load and mobile CPU figures — instead of desktop ones. Then they calibrate themselves: on battery, the discharge rate measures the whole laptop, so after 10 minutes on battery PCWattVault learns what the sensors miss and uses it on the charger, where nothing measures. What it learns is kept across restarts. The Dashboard then says “calibrated on battery” under the figure, and Settings → Power model shows how many minutes it has learned from.
Two settings stay in your hands (Settings → Power model):
- PSU efficiency — 88% is a sensible default for a Gold unit at typical load. Check your PSU’s 80 PLUS rating.
- Base load — the fitted value is a starting point; type your own if you know better, or let a smart plug measure it.
The gold standard is a real wall measurement with a Tapo smart plug (Pro) — the next section explains exactly what happens when you connect one. The other real reading comes from a supported power supply: Corsair HXi (HX550i, HX650i, HX750i, HX850i, HX1000i, HX1200i, HX1500i), Corsair RMi (RM550i, RM650i, RM750i, RM850i, RM1000i) or MSI MEG Ai (e.g. Ai1300P). It reports the power it delivers to the PC over its USB link, and PCWattVault converts that to wall power using the efficiency set above — only the smart plug measures at the wall itself. Corsair models without the “i” (RMx, RMe, HX) have no USB link and cannot be read; NZXT power supplies are not supported.
Smart plug: real measurements and auto-calibration (Pro)
Connecting a Tapo P110/P115
- Plug your PC into the Tapo. Whatever is on the plug is what gets measured — for PC-only accuracy, put only the PC on it. If your monitor and speakers share the plug, their watts will be counted (and calibrated) into the PC's figures — fine if that is what you want to track, just know it is a choice.
- In the Tapo app, open your plug → ⚙ → Third-Party Compatibility and enable it. TP-Link requires this one-time step before any third-party app (PCWattVault, Home Assistant, …) may talk to the plug on your own network — without it, the connection test below fails.
- Open Settings → Smart plug: enter the plug's IP address (Tapo app → your plug → Device Info) and your TP-Link account email and password, then press Save credentials & test. You should see a reply like “✓ P110 — 312.4 W right now”. The credentials are needed because that is how Tapo authenticates apps on your own network; they are stored encrypted on your PC and never sent to the internet.
- Tick Use the plug's wall reading and save.
What changes when the plug is connected
- Live watts become a measurement. The dashboard badge switches to “measured at the wall (smart plug)”, and your history and costs are recorded from the real wall reading instead of the model. Note that the prices never change — cost is always wall watts × your tariff; the plug makes the watts (and therefore the money) accurate.
- The software model keeps running silently in the background as a fallback and for the calibration comparison below.
- If the plug drops off (Wi-Fi hiccup, unplugged…), the app waits a few seconds and hands back to the model automatically — history never gets a hole, and no stale number is frozen on screen. When the plug returns, the measurement takes over again by itself.
The plug changed its IP address
Routers can hand out new addresses after a restart or a power cut, so the plug may come back at a different IP. Usually PCWattVault follows it by itself, because it recognises the addresses where the plug has been before. When it cannot — typically because a different device now answers at the plug's old address — the dashboard shows ⚠ Wall measurement paused, names the device that answered, and switches to the software model, so the history carries on without a hole.
To fix it, press Find my plug — on that warning, or in Settings → Smart plug. It checks the addresses on your local network for the exact plug you paired and connects to it again; your credentials stay as they are, and nothing leaves your network. It needs a plug that was paired once with Save credentials & test. If the device that answered is a plug you would rather use from now on, press Save credentials & test instead and PCWattVault switches to it.
To keep the address from changing at all, reserve a fixed address for the plug in your router (usually called DHCP reservation or static lease).
The calibration bar
While a wall measurement is active, the dashboard shows a small bar: measured (the plug) vs model (what the software would have said) and their average gap over the last few minutes.
If the average gap is meaningful, a one-click button appears — “Tune base load by +36 W” — which folds the observed difference into your base-load setting. That is the point of the whole exercise: after one click, the model itself becomes honest, so your numbers stay realistic even when the plug is offline, and even if you later remove it entirely.
Tips for a good calibration:
- Do it during typical, steady use (a few minutes on the dashboard at your normal desktop load — not mid-benchmark, not during a spike).
- The gap naturally varies a little with load, because PSU efficiency is a curve, not a constant. Calibrating at your everyday load gives the best overall fit; you can repeat it whenever the button reappears.
- A large gap is not a bug — it usually means your base load (fans, pumps, RGB, USB gear) was underestimated, which is exactly what the button corrects.
“PSU loss” and “Unattributed”. From version 1.0.22, whenever the power is measured — by a smart plug, by a power supply that reports its input, or by a laptop’s battery — “PSU loss” is only the power supply’s own loss, as the model computes it from your PSU efficiency. Whatever the measurement holds beyond the sensors, the base load and that loss gets a category of its own, “Unattributed”: in the dashboard’s donut, in the live chart’s and History’s tooltips, in the History table, the CSV and the PDF. A large share usually means the base load is set too low, which is what the button above, “Tune base load by +36 W”, corrects. When the measurement reads less than the model, the PSU loss gives way first, then the base load. Days recorded before 1.0.22 keep their remainder under “PSU loss”. Without a measurement there is no “Unattributed”: the model’s total is exactly the sensors plus the base load plus the PSU loss.
Transparency note
PCWattVault is an independent application: it is not affiliated with, endorsed by, or in any commercial relationship with TP-Link. TP-Link and Tapo are trademarks of TP-Link Corporation. The integration talks to the plug through its local device interface — the same community-established approach used by Home Assistant, openHAB and similar projects. TP-Link officially permits third-party local access (that is what the Third-Party Compatibility switch is for) but does not publish this protocol, so treat the feature as best-effort: if a future TP-Link firmware change breaks it, PCWattVault's software model takes over automatically until an update adapts.
Pro features (optional)
The free app is complete — tariffs, history, forecasts, predictions, themes, languages. On top of that, PCWattVault Pro adds:
- Power per app — which apps your PC's power goes to, live and per day, with the change from the days before; see “Power per app (Pro)” above.
- Alerts — Windows notifications when temperature, wall power or daily cost cross your thresholds. Anti-spam built in. Per app too: “App power above N W”, averaged over 1–120 minutes (default 5) so a momentary spike does not count, and “App's cost today above X”. An app's panel on the Apps page has Alert me about this app. From version 1.0.19 there is also a monthly budget: Settings → Alerts → + Add alert, type “Monthly budget”, then a budget per month in your currency. It warns once when the month-end forecast passes the budget — after 3 recorded days, because a forecast from one day is a guess — and once when the month's cost reaches it. Each notice comes at most once per calendar month, also across restarts; a new month, or a changed budget, starts afresh. A new rule suggests the current month-end forecast plus 10%, rounded up. From version 1.0.22 there is also a monthly CO₂ limit: the type “Monthly CO₂ limit”, next to “Monthly budget”, with a limit in kg CO₂. It works like the budget — one warning when the month-end forecast passes the limit (after 3 recorded days), one when the month reaches it, each at most once per calendar month — and counts the whole month at the CO₂ intensity currently set. While CO₂ is switched off (0 g/kWh) the limit stays silent, and Settings says so. When a month stays under its budget or its CO₂ limit, a note says so once, at the start of the next month — for example “Last month came to 8.2 kg CO₂, under your 10 kg limit. Well done!” — for a limit that was set for the whole month, and a month with at least 3 recorded days. No points or badges.
- Sessions — “what did this gaming night / render / training run cost?” Start from the dashboard or the tray; every session records kWh, cost, peak and average watts.
- Reports & export — Excel-friendly CSV, and a monthly PDF report with charts, tariff summary, predictions and a CO₂ line.
- Smart plug — connect a TP-Link Tapo P110/P115 and your history is recorded from real wall measurements. Your TP-Link credentials are stored encrypted on your PC and are used only to talk to the plug on your own network — never sent to the internet.
Right now, all Pro features are free. While PCWattVault is young, every user automatically receives a Founder / Early-Adopter license. And this is a promise, not a trial: if Pro ever becomes a paid upgrade for new users, founder licenses stay free — forever. Nothing to do on your side; you can see yours under Settings → PCWattVault Pro.
Your data
Everything lives in plain JSON files under your user profile (About → Open data folder): hourly energy and cost aggregates per component category — no raw per-second samples, so nobody can reconstruct your minute-by-minute activity. Copy the folder to back it up; delete it to start fresh. There is no telemetry of any kind.
With power per app (Pro), the same folder also holds each app's energy and cost per day, by process name (for example “firefox”), in app-history, and the learnt idle draw of each component in app-floors.json — watts and times only, no app names. Apps you hide are never recorded. To keep an app out, press Hide on its row; to stop or erase the app history, use Settings → Power per app (switch it off, or Clear app history). Your total consumption history stays as it is.
One file lives elsewhere, on purpose: %USERPROFILE%\.pcwattvault\founder.json, 41 bytes holding only the date you first ran the app. Keeping it outside the app's data folder is what lets your early-adopter status survive an uninstall and reinstall on the same PC — which also means an uninstall does not remove it. Delete it by hand if you want no trace left.
FAQ & troubleshooting
CPU shows “~”. Reading CPU power sensors needs a kernel driver, which Store apps may not include. Run the free LibreHardwareMonitor with its Remote Web Server enabled and PCWattVault switches to it automatically — download it only from its official release page on GitHub; “Sensor sources” above has the steps. Until then the app estimates CPU power from load — that is the “~”.
What is PawnIO? A signed, open-source Windows driver that lets LibreHardwareMonitor read the CPU's power and temperature sensors. It replaces the old WinRing0 driver, which Windows security and antivirus software increasingly block. LibreHardwareMonitor offers to install it the first time it runs. PCWattVault itself, from the Microsoft Store, installs no driver — Store apps cannot. You need PawnIO only for measured CPU readings; without it, the CPU shows as a “~” estimate. The steps are under Sensor sources.
The app “doesn’t close”. It keeps recording in the background by design, so the history has no holes. To stop it, right-click the tray icon → Quit (stops recording). Whether closing the window hides it into the tray is a separate choice: Settings → Behaviour → Hide to the tray when the window is closed — recording continues either way.
Can I see the watts without opening the app? Yes. From version 1.0.19 the tray icon shows the live wall watts, refreshed every 2 seconds, and hovering over it shows the watts and the cost per hour. If Windows keeps the icon behind the ^ arrow next to the clock, drag it onto the taskbar.
My NVMe temperature looks different from the vendor tool. PCWattVault shows the official composite sensor — the same one Samsung Magician & co. display. Some tools show the controller hotspot instead, which legitimately runs 20–30 °C hotter.
Two GPUs? Each appears separately, with its own power draw, in Top consumers and Components.
Does it work on laptops? Yes. On battery, PCWattVault reads the laptop's power draw from the battery itself (since version 1.0.10), and the dashboard marks it “measured from the battery” — a measurement, not a model. From version 1.0.18, a card at the top of the dashboard also shows the time left at the current draw and the battery's health. On the charger, the total is an estimate again: LibreHardwareMonitor makes the CPU and GPU readings more precise, but only a smart plug measures the laptop at the wall. From version 1.0.20 that estimate starts from laptop defaults and calibrates itself from the battery after 10 minutes on battery; the dashboard then says “calibrated on battery”. More in How much power does my laptop use?
What is the “System baseline”? A row on the Apps page covering every part's idle draw, the base load and the power supply's loss — what you pay whatever runs, so it is not shared out between apps.
Why does “Windows kernel” use power? Work done by the Windows kernel is charged to it, and that includes security software scanning files — your antivirus among them.
Why does the “Apps” page say it is still learning? To share power between apps, PCWattVault first needs each component's idle draw, which it learns from moments when the PC is idle; until then, the page says so. For the CPU, the power outside its cores is measured directly when the sensors allow it, so even a PC that never idles gets a firm split.
Sleep and hibernation are never billed — gaps in time are detected and excluded from the energy integration.
Uninstalling removes the app and, as with every Store app, Windows also removes its data. Want to keep your history? Copy the data folder first (About → Open data folder) — dropping it back later restores everything. Your early-adopter status survives it: the founder marker is kept outside the data folder (see “Your data”).
Privacy
The full inventory of what is stored (and what is not) lives at pcwattvault.com/privacy. The short version: everything stays on your machine.